


This is unpublished
Overview
In sharing demographic data, we hope to:
- Examine who we are as a community in terms of race/ethnicity, gender, disability status, and age. Are we reflective of the Seattle region? Do we resemble the communities that we serve? How can we be more inclusive of our community members?
- Provide transparency to our community.
- Establish a baseline in evaluating DOM’s progress in becoming a more equitable, diverse, and inclusive organization.
- Share our demographics and progress with prospective faculty, staff, and trainees.
- Identify variations in demographics by different categories of faculty, trainees, and staff and develop initiatives to improve equity.
- Provide metrics to support organizational accountability.
Race/Ethnicity
Faculty Race/Ethnicity, 2023

Faculty race/ethnicity by track, 2023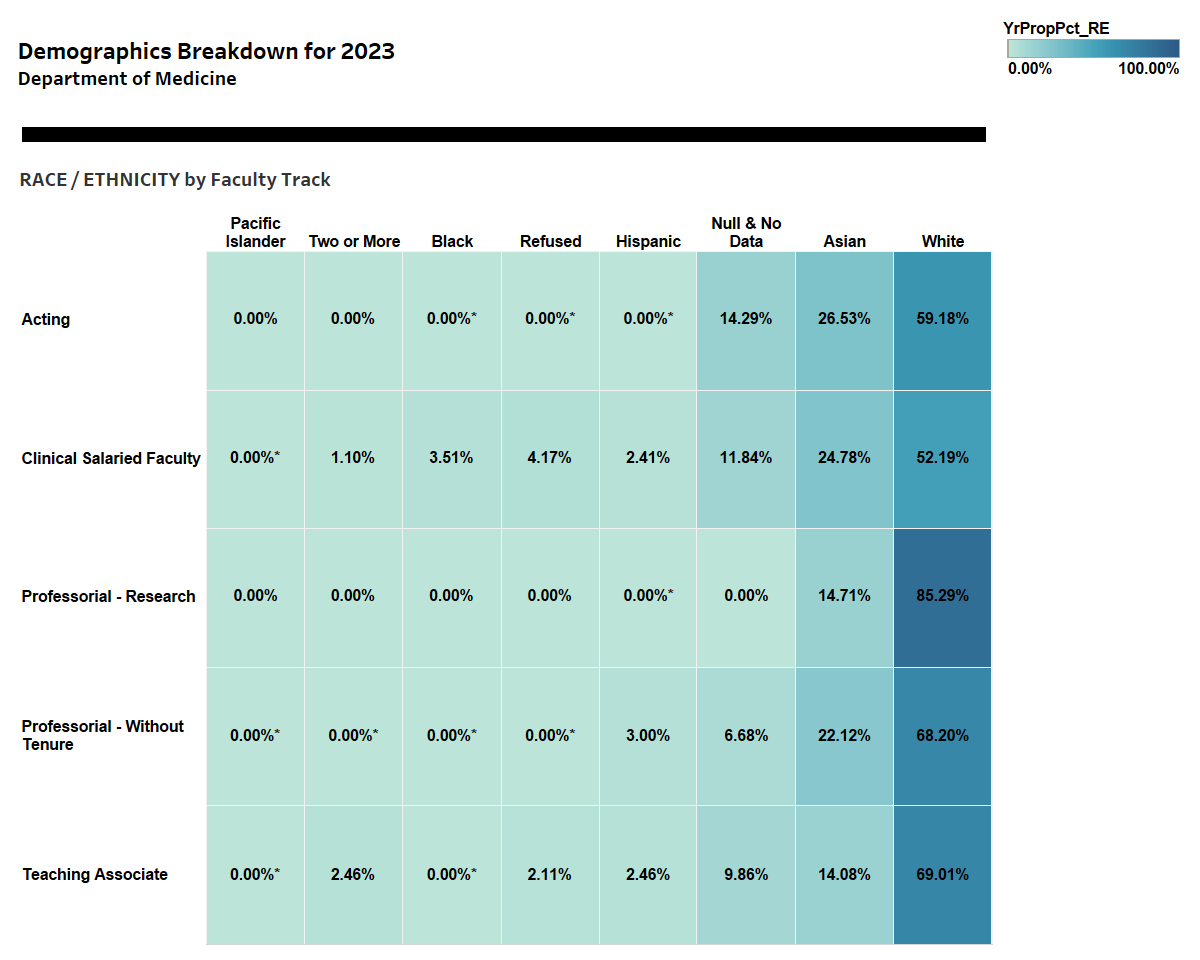
- In 2023 there were 1345 faculty members in the Department of Medicine.
- The DOM has grown by 20.7% since 2019, when there were 1091 faculty members. This growth was primarily driven by additions to the Clinical Salaried Faculty and Teaching Associate tracks.
- Due to missing information (Null/no data + Refused, 11.4%), a direct comparison to Seattle demographics may not be accurate for most racial/ethnic categories.
- Compared to Seattle as a whole, it is likely that there is a lower proportion of DOM faculty who identify as Black and Latino.
*While these are non-zero cells, due to the small number of faculty in this category University rules do not allow us to list the percentage.
Faculty Race/Ethnicity Trends, 2017-2023
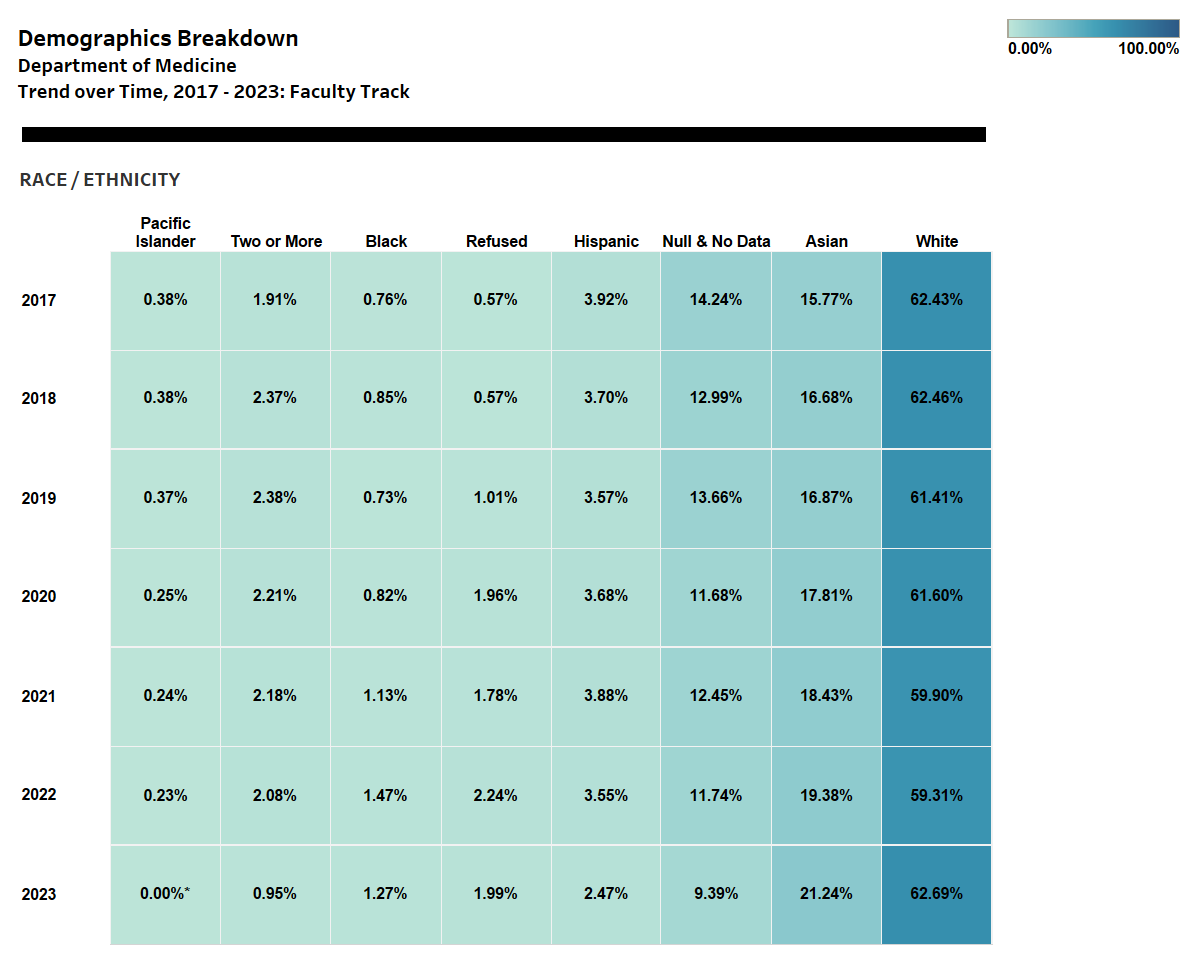
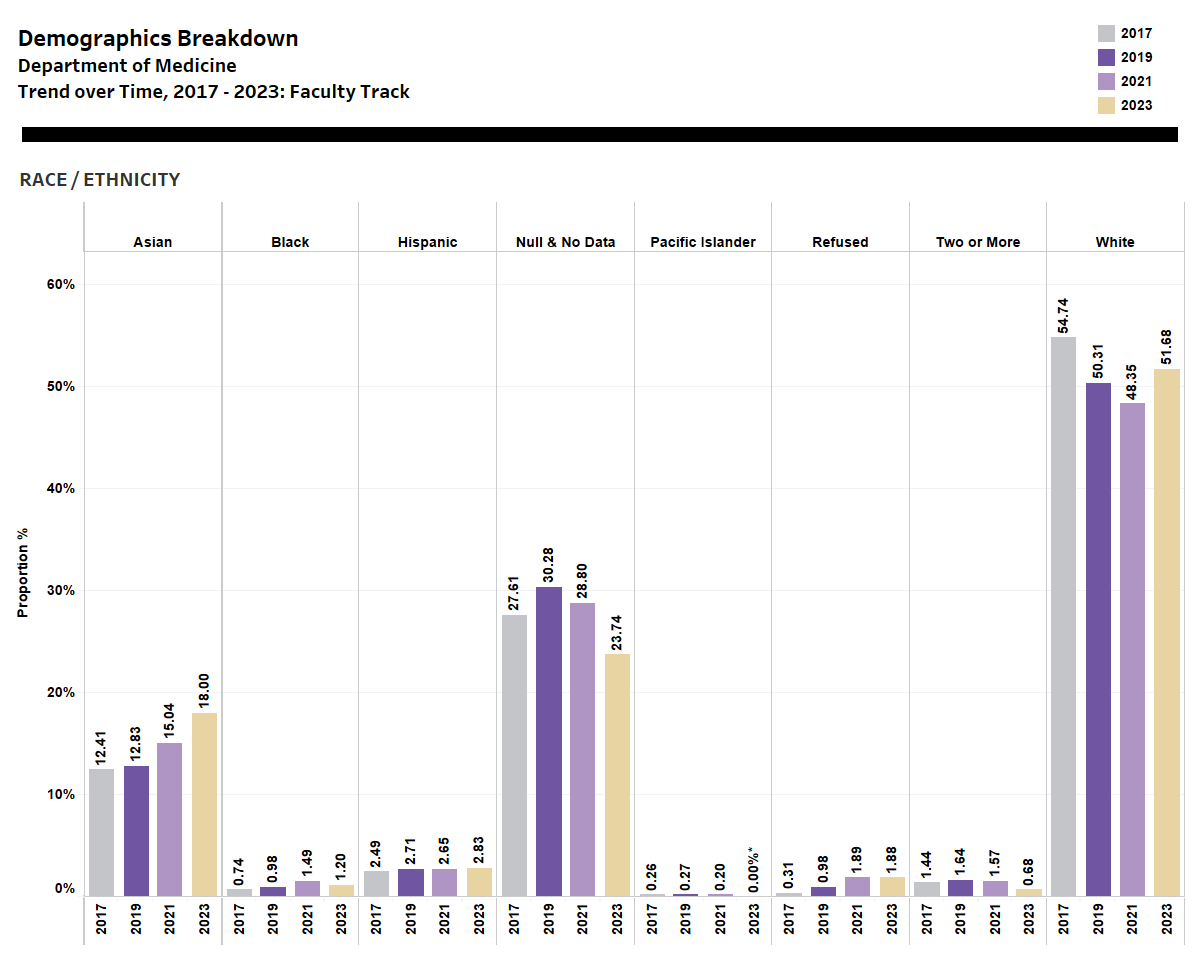
- The proportion of faculty who declined or had no data for race/ethnicity was 13.7% in 2019 and 9.4% in 2023.
- There was a greater proportion of faculty who identify as Asian or Black in 2023 compared to 2019
- The proportion of faculty who identify as BIPOC has increased from 23.9% to 26% over the last five years.
- The proportion of faculty who come from ethnic backgrounds underrepresented in medicine (URM**) was 3.74% in 2023, a decrease from the 2019 (4.67%) and 2022 proportions (5.25%).
- There were no faculty members who identified as American Indian/Native Alaskan during the 2019-2023 time period.
*While these are non-zero cells, due to the small number of faculty in this category University rules do not allow us to list the percentage.
**Includes people who identify with one of the following categories: American Indian/Native Alaskan, Black, Latino, and Native Hawaiian/Pacific Islander.
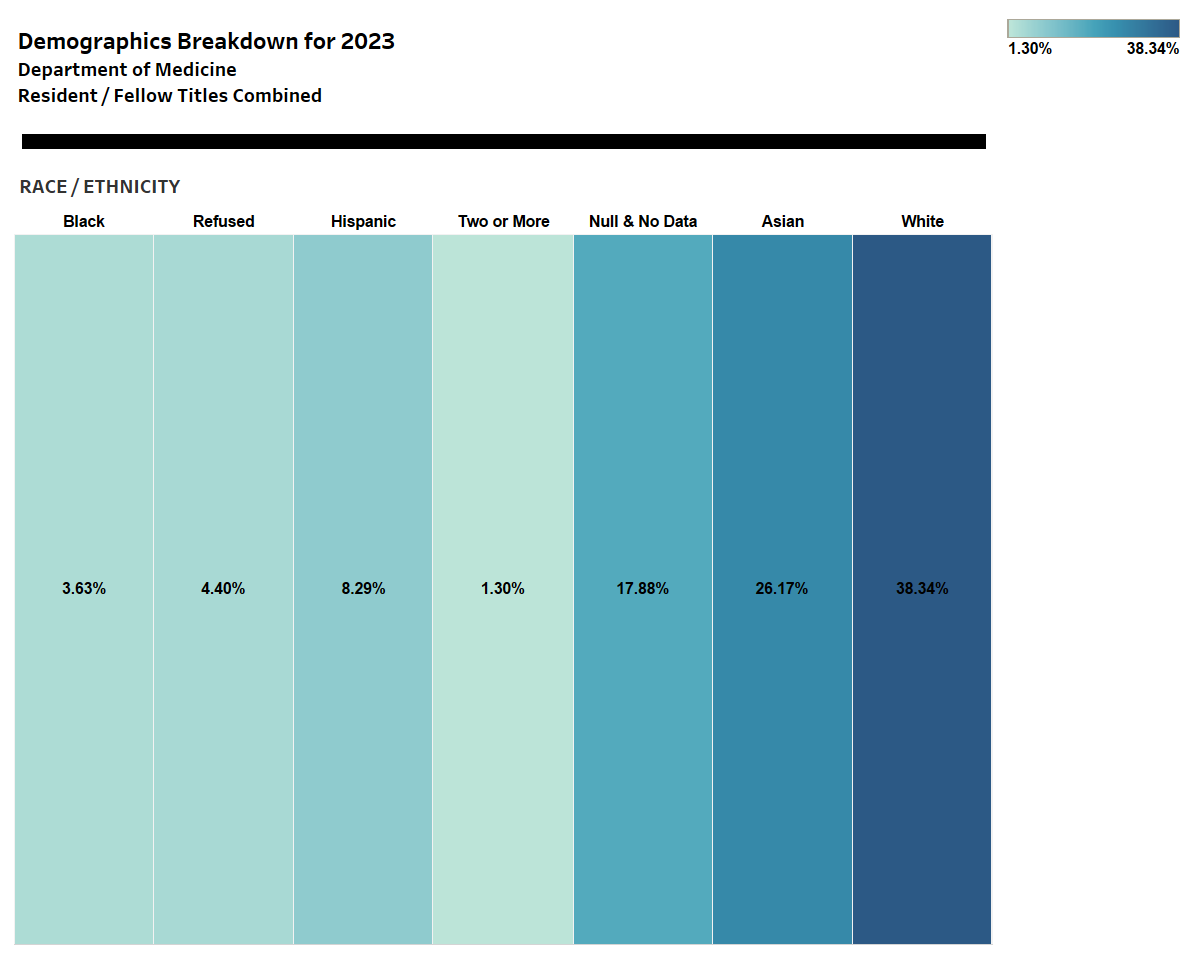
Resident & Fellow Race/Ethnicity, 2023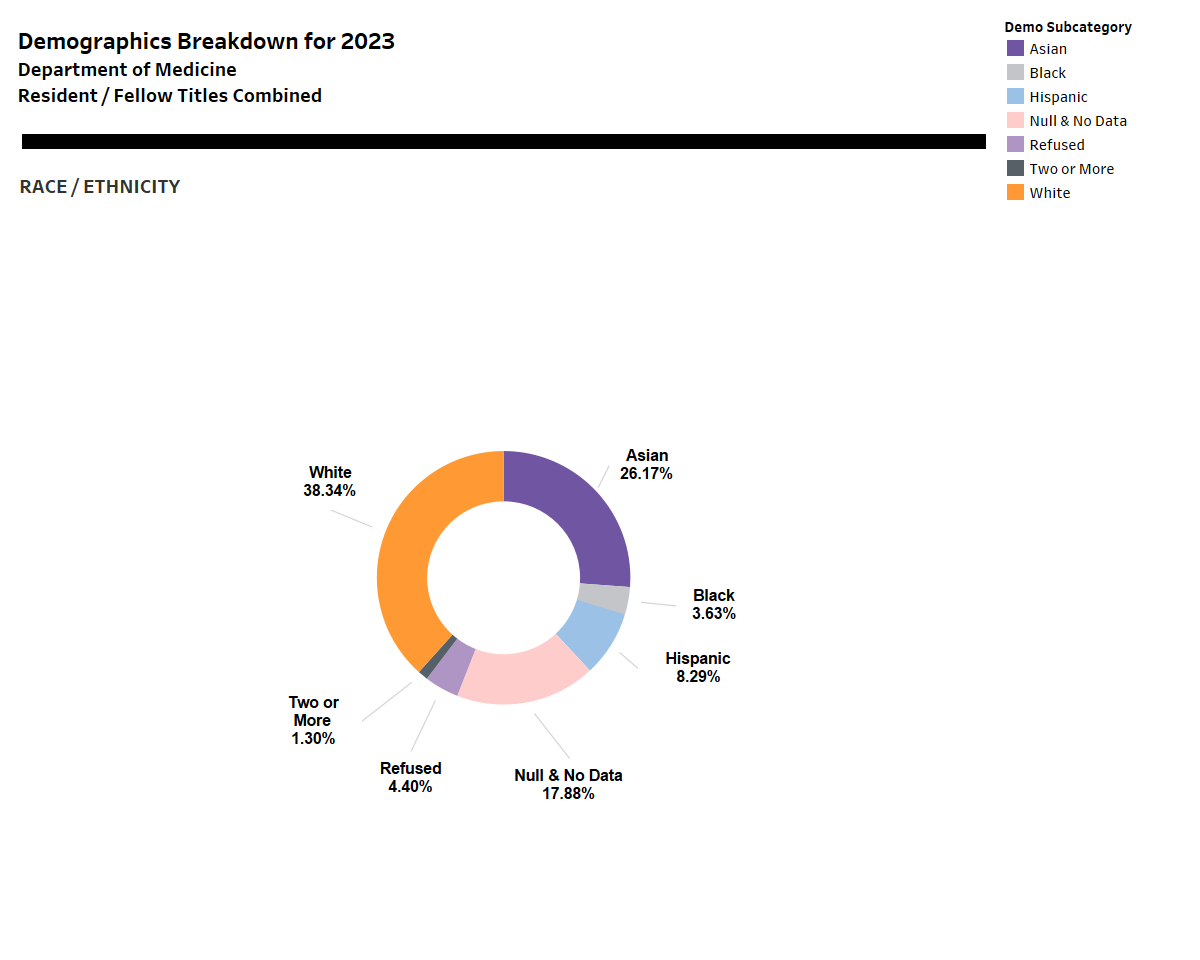
- The proportion of missing race/ethnicity information (Refused plus No Data) was high overall at 22.3% (17.5% and 26.3% for residents and fellows, respectively).
- After excluding DOM members with missing (Refused plus No Data) race/ethnicity data, the overall frequency of residents and fellows who identified as Asian, Black, Latino, white, or 2 or more ethnicities was 33.7%, 4.7%, 10.7%, 49.3%, and 1.7%, respectively.
- No residents or fellows self-identified as Native Hawaiian, Pacific Islander, American Indian, or Alaska Native in 2023.
- After excluding DOM members with missing (Refused plus No Data) race/ethnicity data, the proportion of residents who identified as Asian, Black, Latino, white, or 2 or more ethnicities was 33.5%, 3.5%, 8.8%, 51.8%, and 2.9% respectively (denominator, n=170).
- After excluding DOM members with missing race/ethnicity data, the proportion of fellows who identified as Asian, Black, Latino, or white was 33.8%, 6.2%, 13.1% and 46.9% respectively (denominator, n=130).
Gender
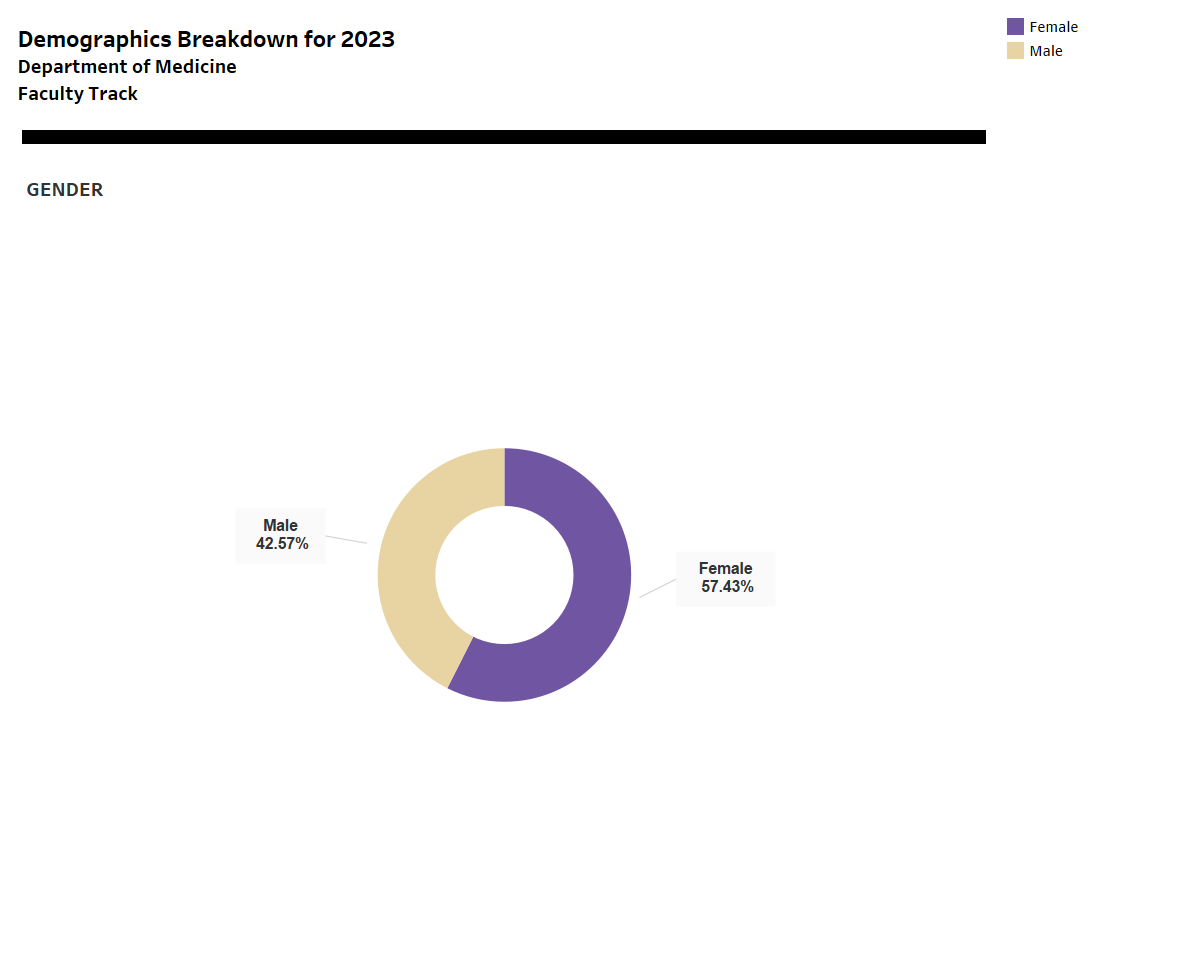
Faculty by gender, 2023
Faculty by gender trends, 2017-2023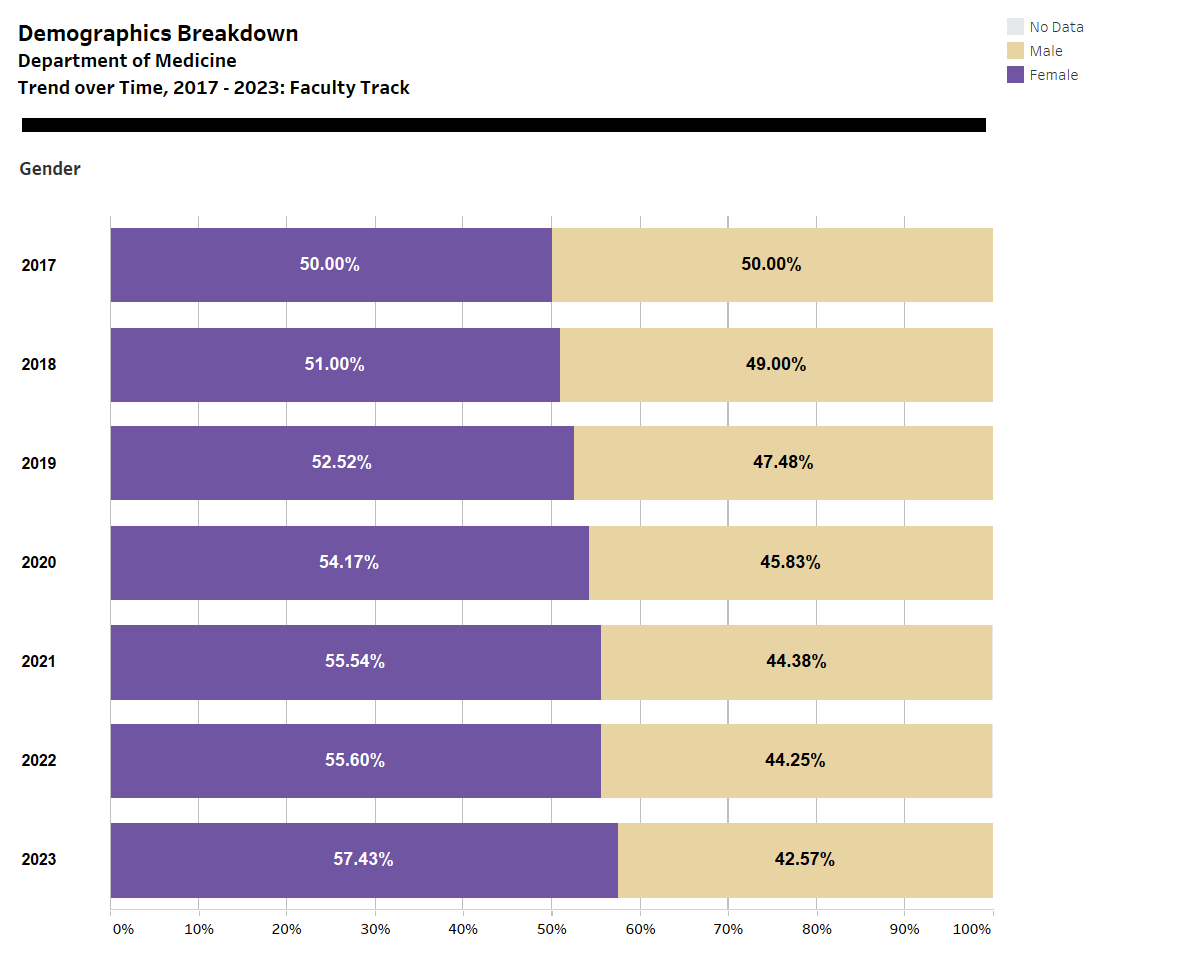
- In 2023, 57.4% of faculty identified as female. This is a higher percentage of DOM faculty members who identify as female relative to Seattle’s population (48.9%).
- UW DOM faculty who identify as female has increased over the last five years, from 52.5% to 57.4%.
- In 2023, there was a higher proportion of faculty who identify as women in the Teaching Associate track compared to the overall DOM (57%) and lower proportion in the Professorial Tenured and Without Tenure tracks.
Residents/fellows by gender, 2023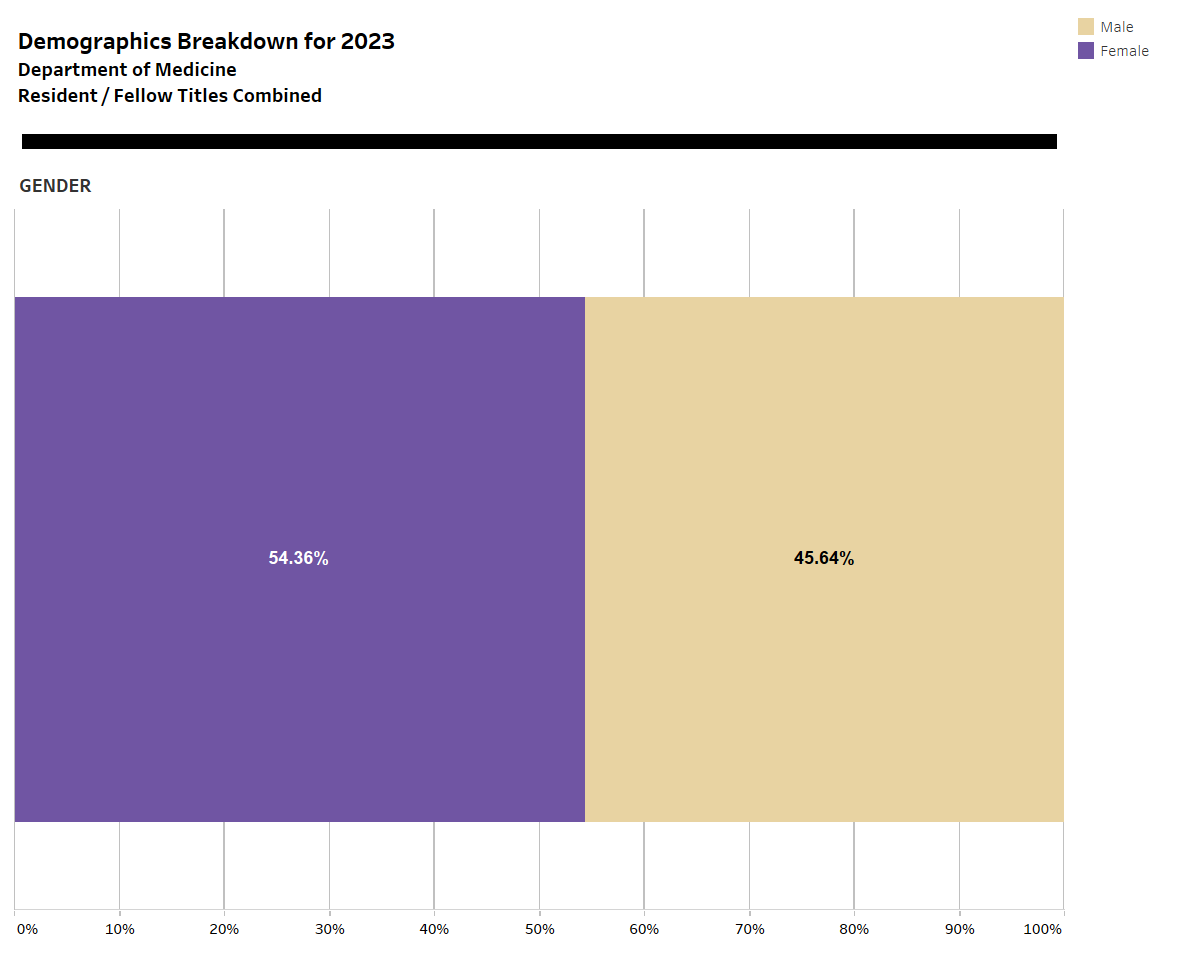
- In 2023, there were 390 DOM trainees, 211 residents/chief residents, and 179 fellows, among whom more than one-half identified as female.
Disability and Veteran Status
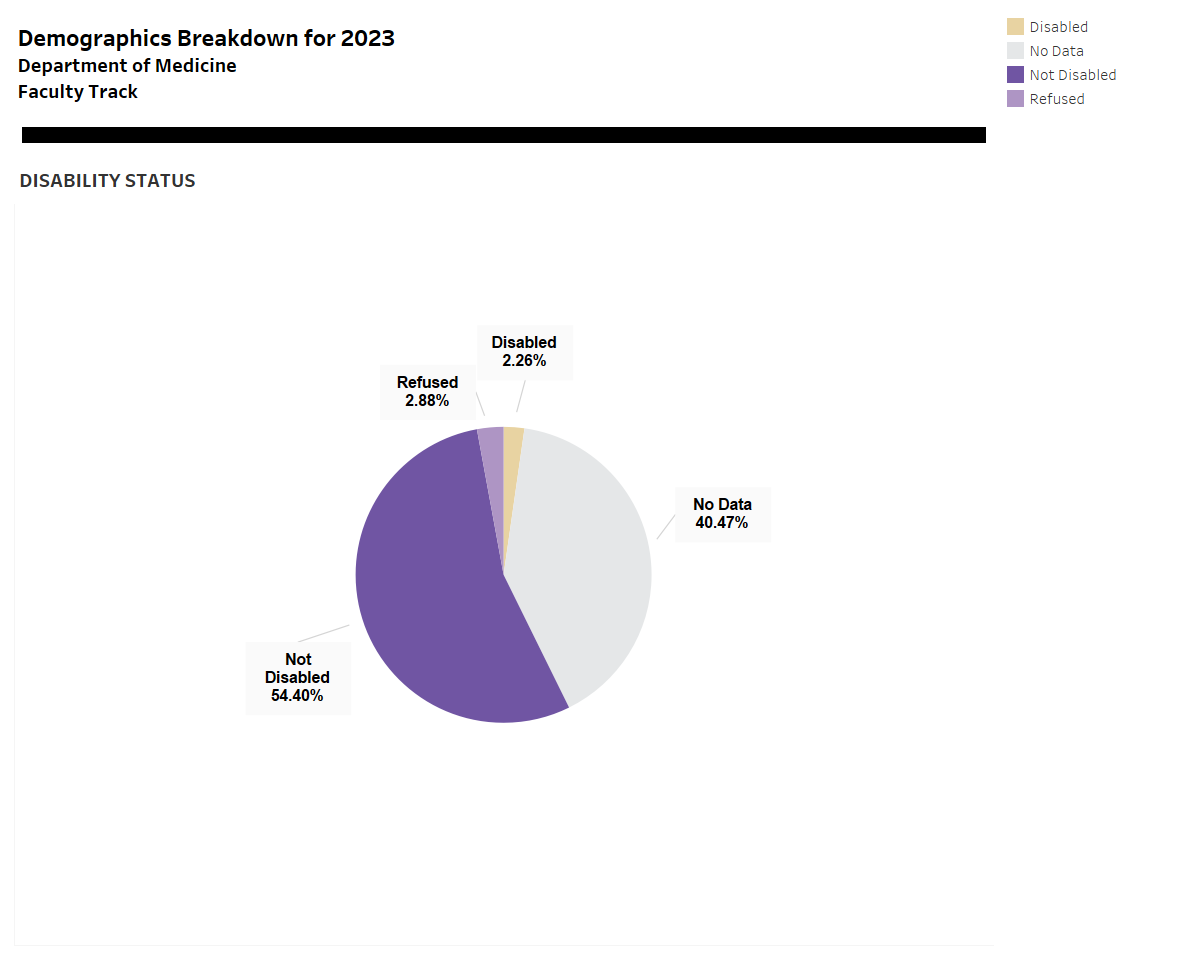
Faculty Disability Status, 2023
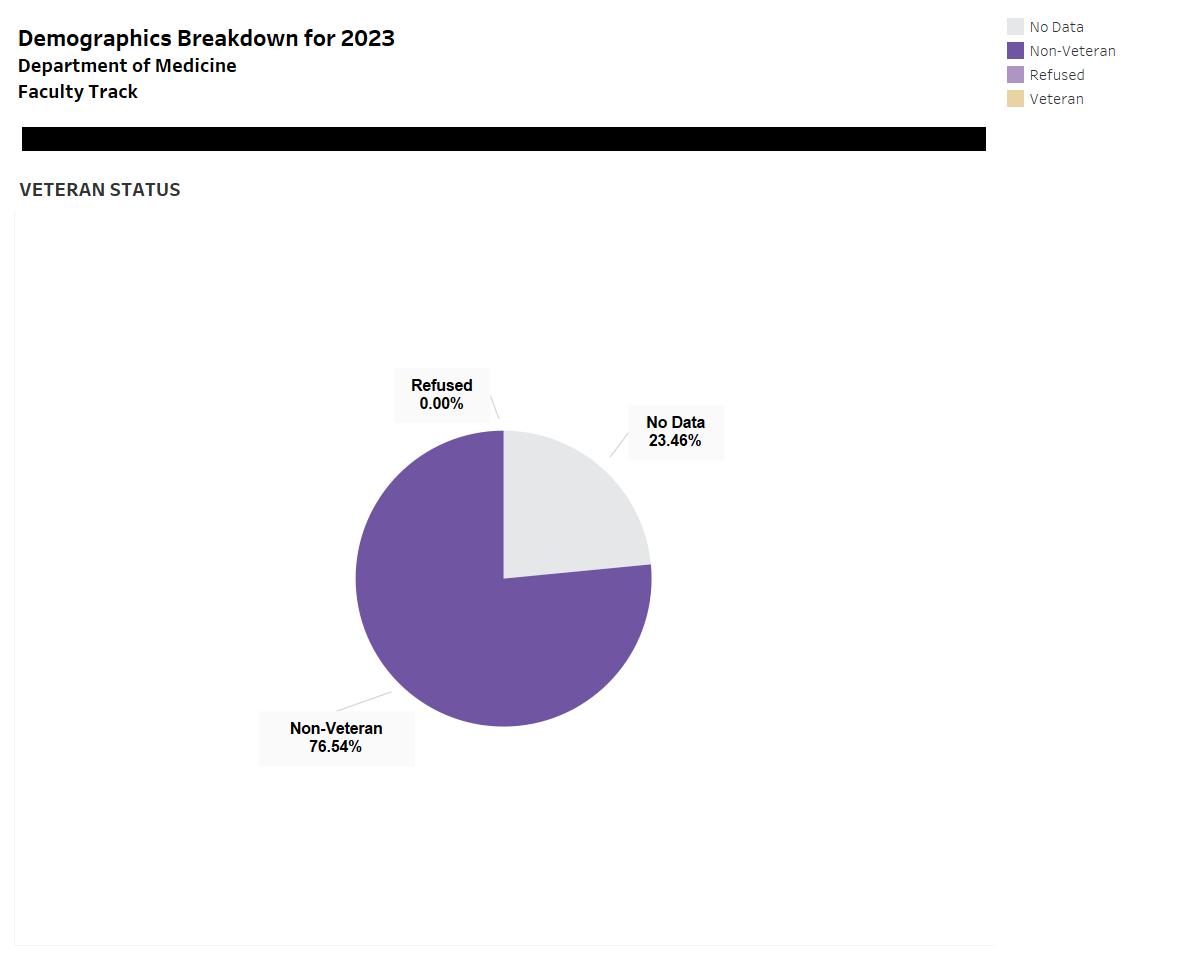
Faculty Veteran Status, 2023
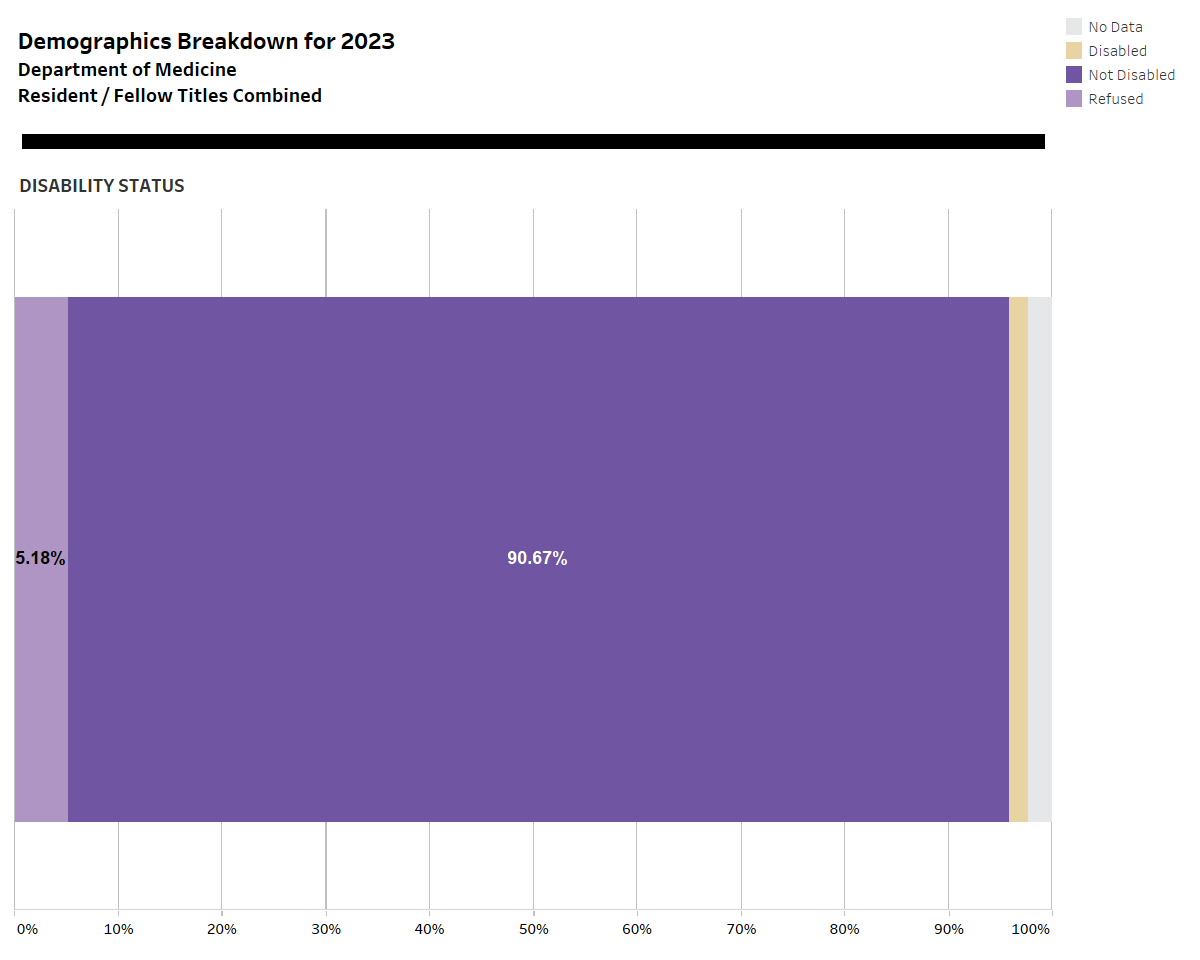
Resident and Fellow Disability Status, 2023
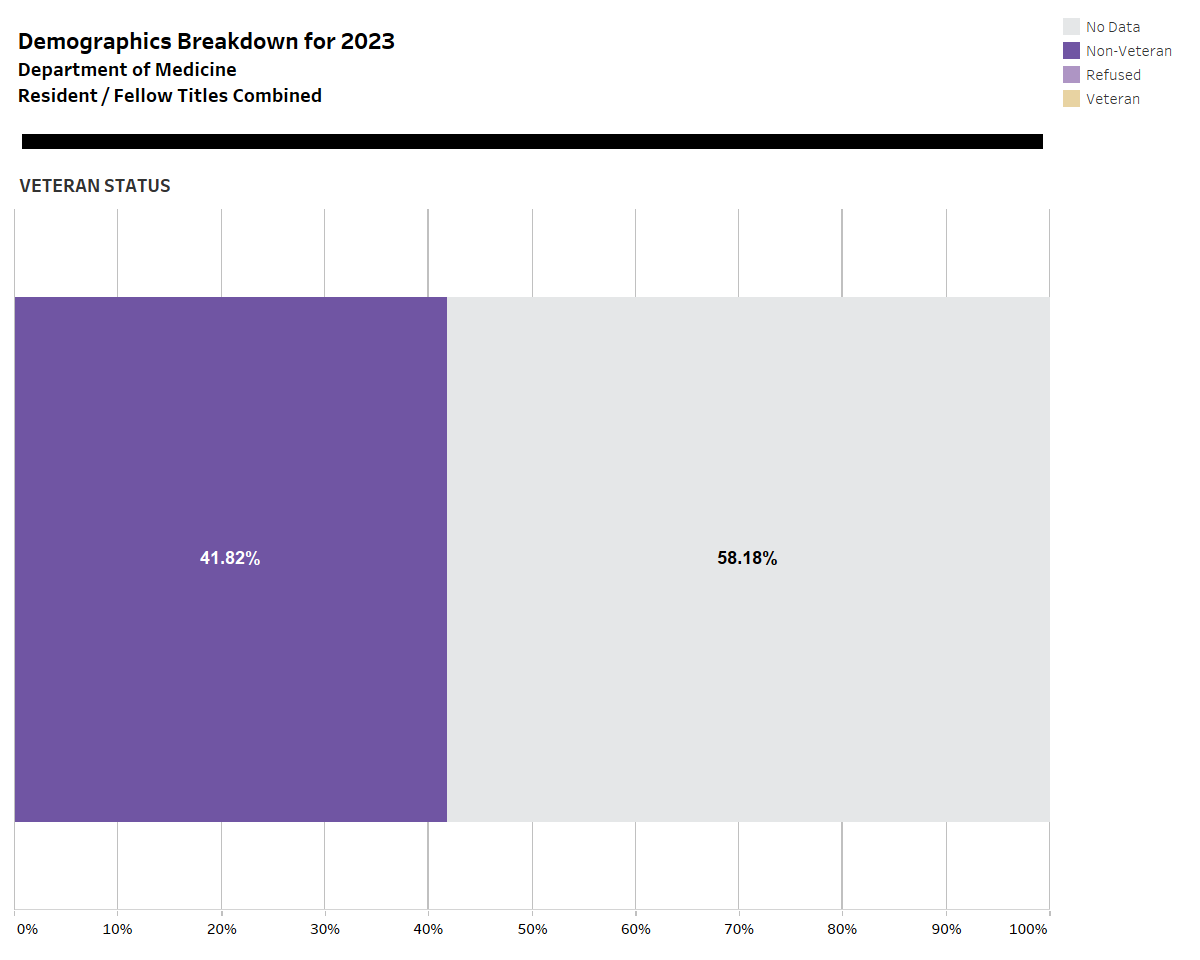
Resident & Fellow Veteran Status, 2023
- 2.3% of faculty self-reported a disability in 2023.
- The proportion of missing information on disability status is high (Null/no data + Refused, 43.4%).
- The proportion of missing information on veteran status is high (Null/no data + Refused, 23.5%). No faculty reported that they have veteran status. The proportion of the Seattle area population who are veterans is 3.2%.
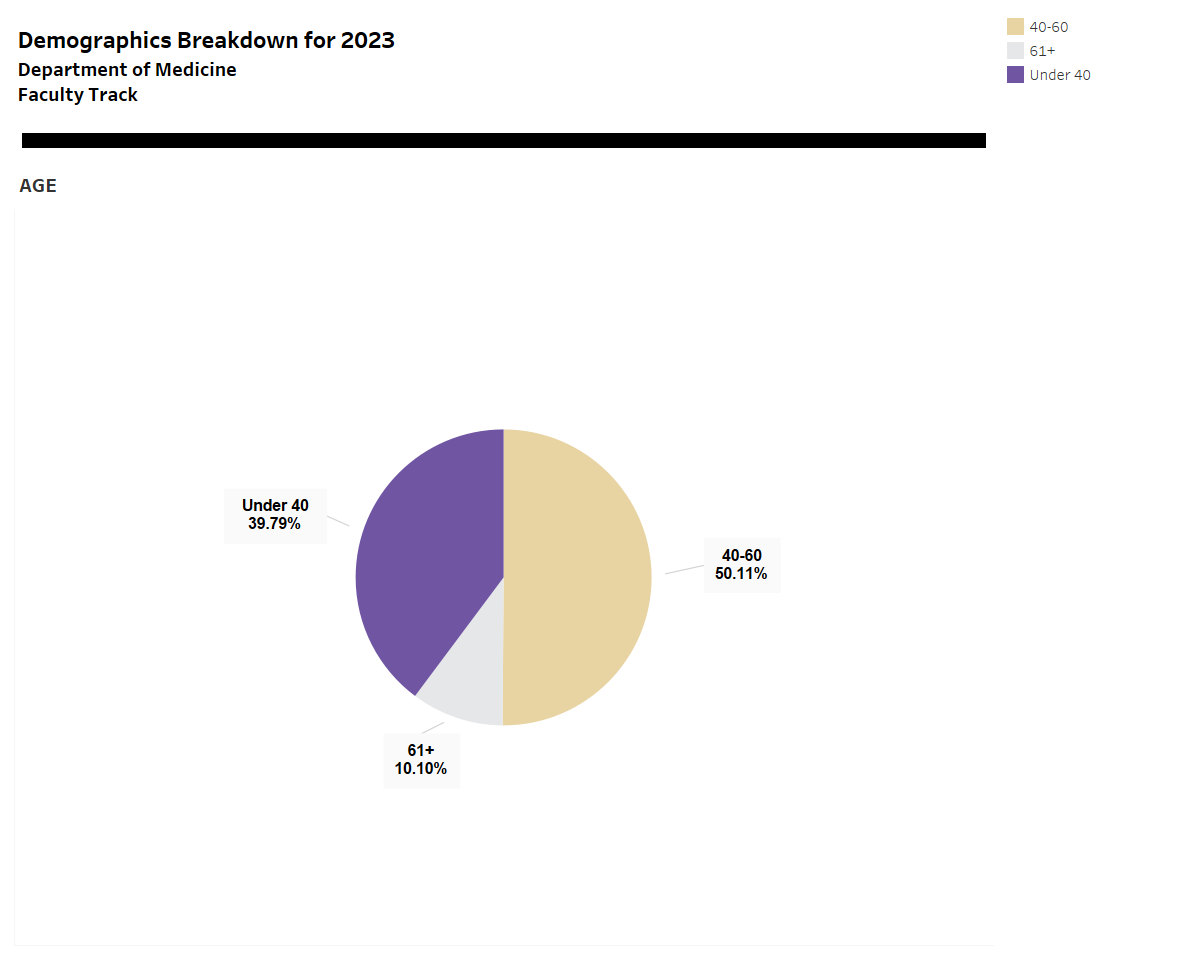
Age
Faculty by age, 2023
Faculty by age trends, 2019-2023
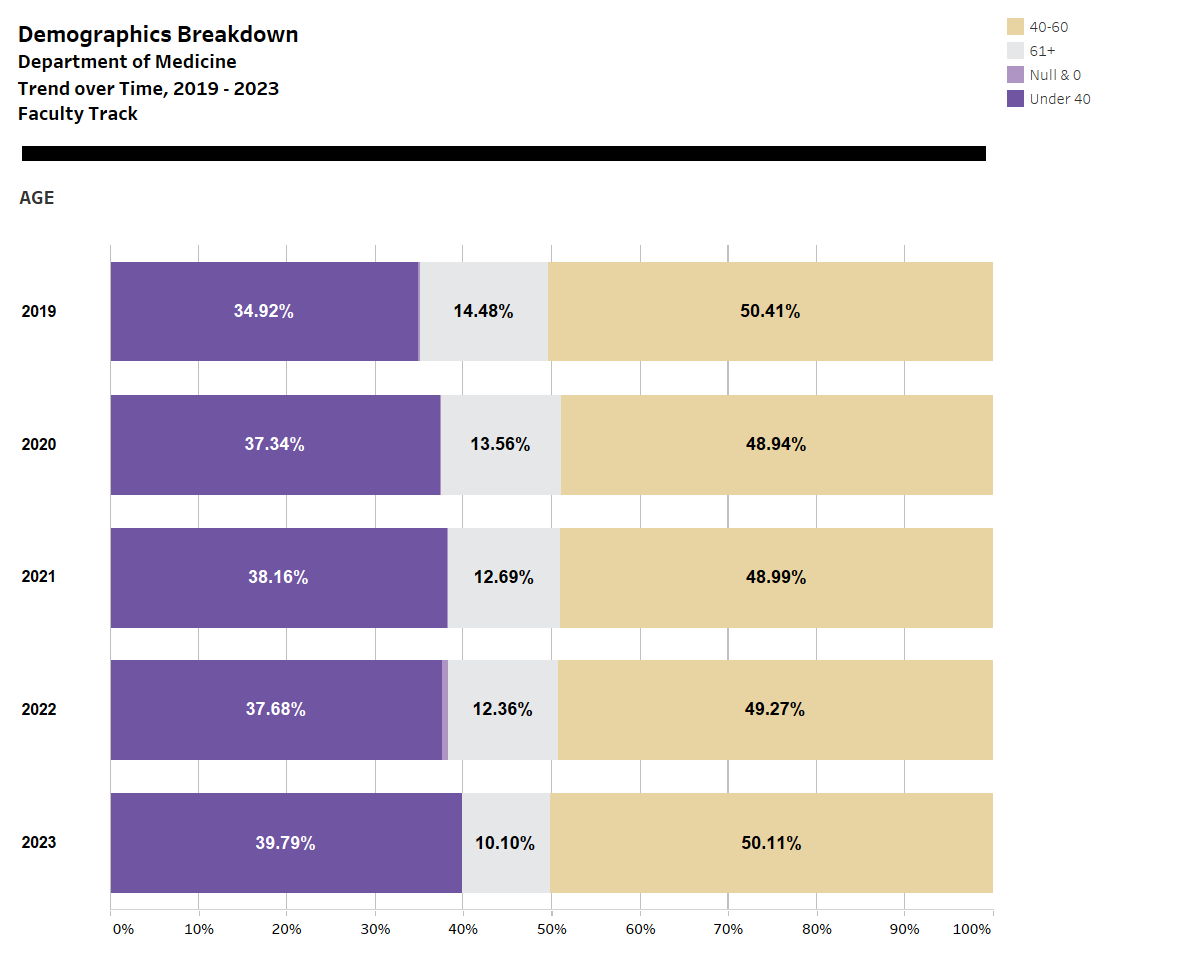
- From 2019 to 2023, the proportion of faculty under 40 has increased, while the proportion 61 years and older has decreased.
Resident/fellows by age, 2023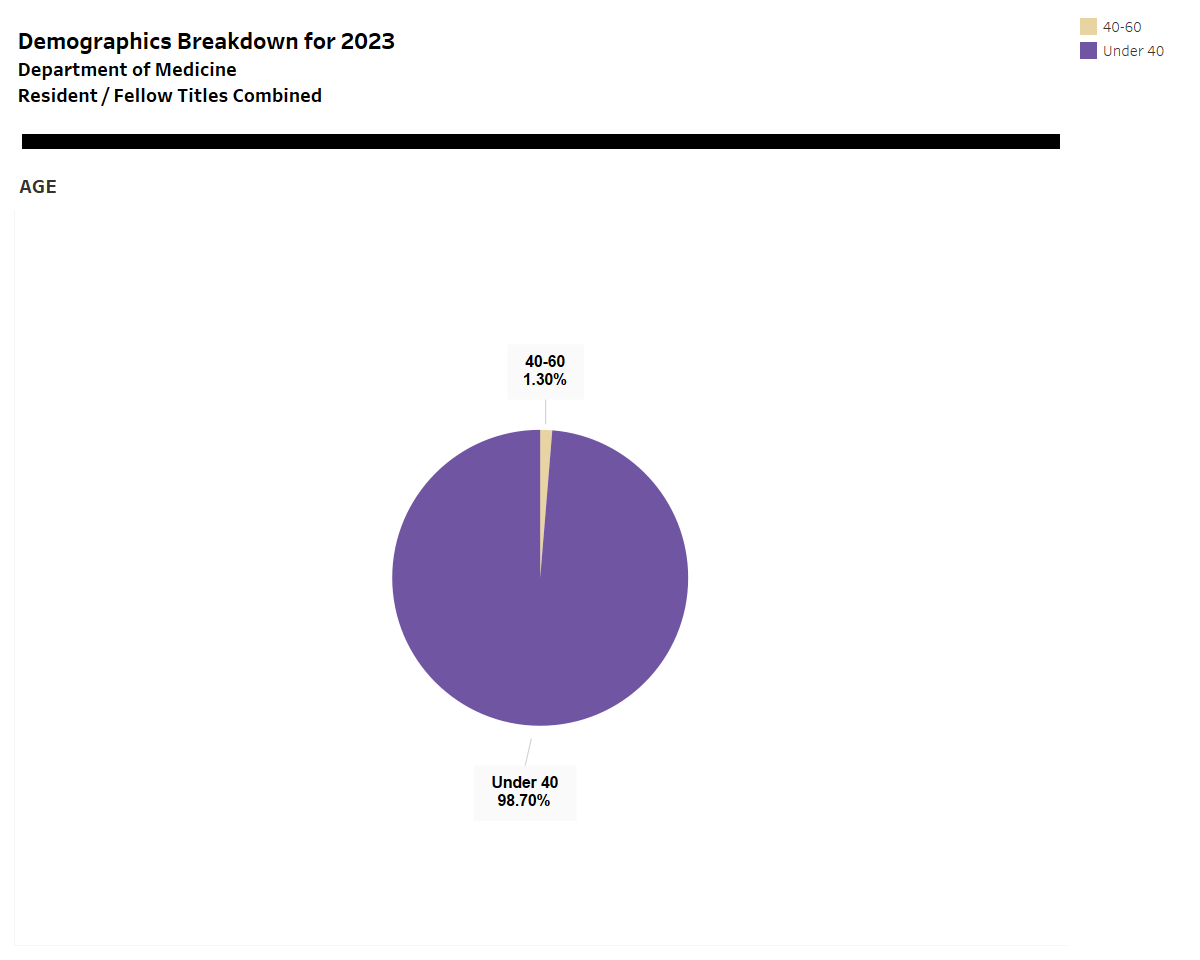
Staff
This is the first year we have access to and can report on the demographics of staff in the Department of Medicine.

- As of December 31, 2023, there were 819 staff members of the Department of Medicine, 75.2% of whom identified as female.
- In terms of race and ethnicity, 54.6% identified as white, 26.9% as Asian, 5.7% as Hispanic or Latino, 5.0% as more than one race/ethnicity 3.4% as Black, 0.2 % as Native Hawaiian or Pacific Islander and 0.1% as American Indian or Alaska Native.
- 1.5% of staff members indicated that they are veterans.
- 12.0% of staff members reported that they live with a disability.